MindSage engineering notes · 01
WAL, one index and a query rewrite: making a local journal app's SQLite stay flat at 50,000 entries
I benchmarked my Electron journal app before touching it. The fix for the slowest list query was three small changes, and one of them made things worse until the other two landed.
MindSage is a Windows journaling app I'm building on my own. Everything runs on your PC: entries go into a SQLite file through better-sqlite3 in Electron's main process, a local model writes titles, mood tags and summaries, and a semantic index lets you ask questions about your own writing. Nothing goes to a server, so there is no backend to scale. The only thing that can get slow is the user's own laptop.
That makes the database the whole performance story. A journal grows by one or two rows a day for years, and every screen in the app reads it. So before changing anything I built a benchmark harness, measured the app as it stood, and only then started fixing. This post covers the three database changes that mattered, the one that backfired, and the regressions I chose to keep.
The harness, briefly
npm run bench seeds a fresh database at three sizes and times every query the app's screens make, reporting p50 and p95. The sizes are deliberate:
- 150 entries is a few months of use.
- 5,000 entries is a daily journal kept for about 14 years. This is the realistic worst case.
- 50,000 entries is not a real user. It exists to show the slope: a query that is fine at 5,000 but grows 300× by 50,000 is scanning, and it will hurt someone eventually.
Alongside the timings, the harness runs EXPLAIN QUERY PLAN on every query and counts the full table scans. Every run is saved as JSON under a label, and the comparison reports and the status board are generated from those files. Nobody types a number into the docs, so no figure can go stale.
All numbers below come from one laptop: an Intel i5-9300H with 16 GB of RAM on Windows 11, Node 24. "Before" is the run labelled phase-0-2026-10-06 and "after" is phase-1-2026-10-06, both from the same day on the same OS build.
Problem 1: reads were waiting behind the background writer
The app has two database connections to the same file: the main process serves the UI, and a background worker writes AI results and index updates. The benchmark reproduces this by reading the journal list while a worker thread writes.
The list query takes under a millisecond on its own. While the worker wrote, its p95 was 311 ms at 150 entries and 436 ms at 50,000. That's the one that mattered most, because it hit tiny journals too. SQLite's default rollback journal lets a writer lock out every reader, so the UI simply waited.
My audit notes had predicted SQLITE_BUSY errors and recommended busy_timeout = 5000. The benchmark recorded zero busy errors, and busy_timeout was already 5000 because better-sqlite3 sets that by default. Half the planned fix was a no-op. The failure was waiting, not failing.
The real fix is two lines:
db.pragma("journal_mode = WAL");
db.pragma("synchronous = NORMAL");
In WAL mode, readers keep reading the last committed state while a write is in progress. synchronous = NORMAL drops the fsync on every commit. In WAL mode that is still safe against an app crash, and the worst case is losing the last few commits on a power cut. For a journal that autosaves, I took that trade.
Reads under worker writes went from 436 ms to 0.37 ms p95 at 50,000 entries. Single writes got faster as a side effect: write.create went from 6.76 ms to 0.41 ms.
To make sure a speedup really came from WAL, every report prints the pragmas the database actually ran with. If that table had still said delete, the claim would have been invalid.
Problem 2: the busiest table had no index
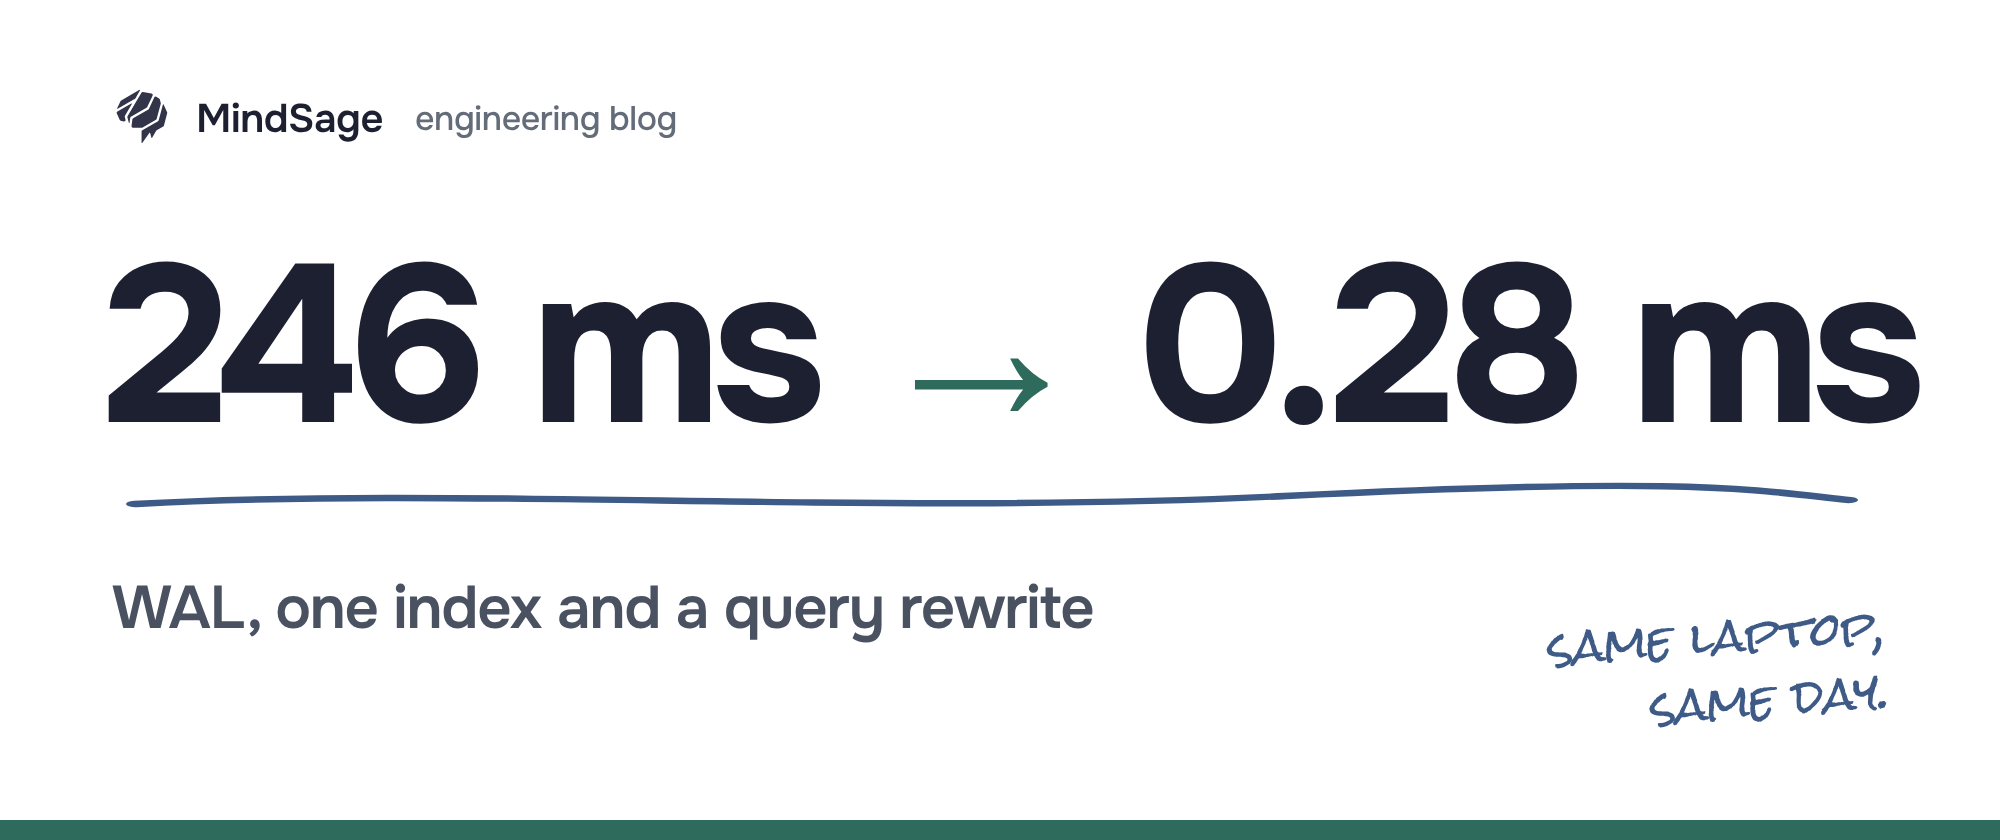
Goals, categories, chats and tags all had indexes. journal_entries, the table every screen reads, had none. The baseline plan reported 41 full table scans per run. Opening the journal list at 50,000 entries cost 246 ms p95.
Every list query filters by user and hides deleted entries, then orders by date, so the obvious index is a composite one in that order:
CREATE INDEX IF NOT EXISTS idx_je_user_deleted_created
  ON journal_entries(user_id, is_deleted, created_at);
The index alone made it slower
My quick benchmark run after adding the index showed list.page1 at 5,000 entries going from 9 ms to 98 ms. Ten times worse.
The list query pulled each entry's tags with a LEFT JOIN and a GROUP BY j.id. Grouping forced SQLite to visit and sort every entry before LIMIT 10 could apply. With the new index available, the planner picked a plan that sorted the whole set twice. The index could not help a query that had to touch every row anyway.
The fix was to stop grouping. Tags now come from a correlated subquery, which runs only for the ten rows that survive the LIMIT:
-- before (simplified)
SELECT j.*, GROUP_CONCAT(t.name) AS mood_tags
FROM journal_entries j
LEFT JOIN journal_entry_tags jt ON jt.journal_entry_id = j.id
LEFT JOIN tags t ON t.id = jt.tag_id
WHERE j.user_id = ? AND j.is_deleted = 0
  AND DATE(j.created_at) >= DATE(?)
GROUP BY j.id
ORDER BY DATETIME(j.created_at) DESC
LIMIT ? OFFSET ?;

-- after
SELECT j.*,
  (SELECT GROUP_CONCAT(t.name)
     FROM journal_entry_tags jt
     JOIN tags t ON t.id = jt.tag_id
    WHERE jt.journal_entry_id = j.id) AS mood_tags
FROM journal_entries j
WHERE j.user_id = ? AND j.is_deleted = 0
  AND j.created_at >= DATE(?)
ORDER BY j.created_at DESC
LIMIT ? OFFSET ?;
Functions on a column hide it from the index
The second change in that diff is easy to miss. The date filter wrapped the column in DATE() and the sort wrapped it in DATETIME(). Once a column is inside a function, SQLite has to evaluate the function for every row, and no index on created_at can be used.
Every writer in the app already stores created_at as an ISO 8601 UTC string from toISOString(), and ISO strings sort correctly as text. So the column can be compared bare. The upper bound became created_at < DATE(?, '+1 day'), which keeps the whole of the last day, exactly what DATE(created_at) <= DATE(?) used to select.
The index, the subquery and the bare comparisons only work together. Shipped alone, the index was a regression.
The results
Full table scans per run went from 41 to 12. At 50,000 entries, p95:
phase-0-2026-10-06. After: phase-1-2026-10-06. Same laptop, same day.The list queries are now flat: list.page1 is 0.30 ms at 150 entries, 0.28 ms at 5,000 and 0.30 ms at 50,000. That's what an index serving the ORDER BY and stopping after one page looks like.
What I didn't fix, and the regression I kept
Two rows in that chart are not wins.
dashboard.stats went from 1.63 s to 891 ms and is still far above its 100 ms target. It runs eight aggregates over every entry for streaks and totals. An index can't make "count everything" cheap. The fix is one pass plus a cache invalidated on write, and that's still open. At 5,000 entries it's about 60 ms, so real users don't feel it yet.
gallery.random got slower, 953 ms to 1.25 s. It picks random photos with eleven image_key IS NOT NULL ... OFFSET ? queries. With the new index, each one walks the index and fetches every row just to test image_key, which turned out slower than the scan it replaced. I logged it as an accepted regression rather than holding back a change that made the main list 800× faster. The query itself needs replacing.
The comparison tool lists every measurement that got worse at the top of the report, with the line "A win elsewhere does not cancel these." I think that rule did more for the quality of this work than any single optimisation.
Problem 3: a whole search server for 5,000 vectors
Semantic search used to run on Qdrant, shipped as a sidecar process next to the app. Qdrant is very fast: 2.4 ms p95 at 5,000 vectors and 5.4 ms at 50,000, thanks to its HNSW index. But it was a second process to start, supervise and keep in sync with SQLite. It took about 0.5 s of startup, 594 MB of resident memory and 995 MB of disk at 50,000 vectors.
I replaced it with sqlite-vec, an extension that loads into the same better-sqlite3 connection. The vectors now live in a vec0 virtual table in the journal file itself:
CREATE VIRTUAL TABLE IF NOT EXISTS vec_entries USING vec0(
  embedding float[768] distance_metric=cosine,
  user_id integer partition key
);
The partition key means a search only reads the signed-in user's vectors. The table is created outside the numbered migrations, so a machine that can't load the extension still opens its journal and only search reports itself unavailable.
sqlite-vec does exact brute-force search, so it is slower than Qdrant, and I want to be upfront about that:
| At 50,000 vectors unless noted | Qdrant | sqlite-vec |
|---|---|---|
| Search p95 at 5,000 | 2.4 ms | 23 ms |
| Search p95 at 50,000 | 5.4 ms | 192 ms |
| Disk | 995 MB | 155 MB |
| Resident memory | 594 MB | 148 MB |
| Upsert rate | 1× | about 3× |
| Extra processes | 1 | 0 |
The trade made sense because of another benchmark. The chat feature's pipeline took about 14 s per answer, and vector search was 0.03% of it (4.5 ms). Two sequential LLM calls took the rest. Making retrieval 20 ms slower changes nothing anyone can feel. Removing a whole process, most of a gigabyte of disk and the work of keeping two stores in sync does.
It also made deletion simpler. The vector is a row in the same file, so deleting an entry and its vector happens in one transaction. Before, the two stores could disagree.
On a 4-core cloud sandbox, with the vector file memory-mapped, search came in at 9 to 11 ms at 5,000 vectors. That's a different machine, so I don't compare it with the laptop numbers above.
A WAL gotcha that matters for a journal
A journal app has to delete properly. When someone empties the trash, the text should leave the file, not linger in free pages. So the connection also sets secure_delete = ON, which overwrites deleted content with zeros.
WAL complicates that. In WAL mode, those zeroed pages are written to mind-sage.db-wal first. Until a checkpoint copies them back, the main file still holds the old page images with the deleted text, and the WAL may hold older frames too. So everything that deletes for good, like the trash purge or deleting a profile, now runs a wal_checkpoint(TRUNCATE) afterwards. It uses a short busy timeout, so a reader holding the WAL can't freeze the main process for five seconds.
It's an easy one to miss: WAL and secure delete each do their job, and only together do they leave deleted text behind for a while.
The installer, while I was there
The same harness tracks disk footprint, so packaging fixes got measured too:
The target is under 180 MB. Most of what's left is the bundled Whisper speech model and Electron itself.
What I'd tell myself at the start
- Measure the noise before the change. Run the same code against itself. If you skip this, you will celebrate noise.
- Count full scans, not just milliseconds. At 150 entries nearly everything is fast. The query plan shows what will break at 5,000.
- An index is half a fix. If the query has to group or sort every row, or wraps the column in a function, the index can't help and may even hurt.
- Profile the whole pipeline before optimising the part that looks clever. Vector search looked like the hard part of chat. It was 0.03% of it.
- Write down the regressions you accept. A change can be right overall and still make one query slower. Say so in the log.
Next up is dashboard.stats. The chat pipeline, where the 14 seconds actually go, is post 02.